Financial Highlights
FY2023 Financial Highlights
- Net revenue
- 50.9
billion yen
(8.6 billion yen decrease year-on-year)
- Business-related profit*1
- -6.9
billion yen
(18.0 billion yen decrease year-on-year)
- Business-related profit
from customer-related business*2 - 42.8
billion yen
(8.9 billion yen increase year-on-year)
- Profit attributable to
owners
of parent - -49.9
billion yen
(58.6 billion yen decrease year-on-year)
- Business profit + Gains/losses on stock transactions
- excl. financial market-related and retail businesses
1. Key points
- Business-related profit from customer-related business (excl. financial market-related and retail businesses) was 42.8 billion yen, an increase of 8.9 billion yen from the previous year, mainly driven by Aozora’s Strategic Investments Business
- As for U.S. non-recourse office loans, additional provisions were made to loan loss reserves in 3Q after a review of property valuations from a forward-looking perspective. No loans were downgraded to NPLs (“In Danger of Bankruptcy borrowers”) during 4Q, and collection of loans through workouts is steadily progressing
- We proceeded with the timely disposal of securities as planned, resulting in a 189.4 billion yen decrease in securities compared to December 31, 2023 and a loss on sale of 25.0 billion yen in 4Q. Unrealized losses on the securities portfolio after hedging decreased by 30.4 billion yen to 51.1 billion yen compared to December 31, 2023, somewhat less than our estimate as of February 1, 2024
- Profit attributable to owners of parent was a net loss of 49.9 billion yen, resulting from a reversal of deferred tax assets in addition to our initiatives to address the above balance sheet issues
- The consolidated capital adequacy ratio (domestic standard) was 9.23% (preliminary basis). The CET1 (Common Equity Tier 1) ratio was approximately 7.1%
2. Full-year dividend per common share: 76 yen
- (4Q dividend: No dividend)
Financial highlights
Net revenue
Negative figures are not displayed in this graph. For actual figures, please refer to the table below.
(billion yen)
|
FY2019 |
FY2020 |
FY2021 |
FY2022 |
FY2023 |
|
|---|---|---|---|---|---|
|
1Q |
23.3 |
21.3 |
26.7 |
21.4 |
17.7 |
|
2Q |
50.1 |
45.0 |
52.4 |
43.3 |
44.5 |
|
3Q |
75.0 |
69.1 |
79.3 |
55.2 |
60.6 |
|
Full-year |
95.7 |
96.5 |
103.0 |
59.5 |
50.9 |
Business profit
- Negative figures are not displayed in this graph. For actual figures, please refer to the table below.
(billion yen)
|
FY2019 |
FY2020 |
FY2021 |
FY2022 |
FY2023 |
|
|---|---|---|---|---|---|
|
1Q |
11.0 |
8.5 |
13.4 |
7.3 |
3.1 |
|
2Q |
24.9 |
19.0 |
25.7 |
15.0 |
15.6 |
|
3Q |
36.8 |
29.7 |
38.8 |
12.9 |
17.2 |
|
Full-year |
42.3 |
42.6 |
47.8 |
2.5 |
-8.5 |
Ordinary profit
- Negative figures are not displayed in this graph. For actual figures, please refer to the table below.
(billion yen)
|
FY2019 |
FY2020 |
FY2021 |
FY2022 |
FY2023 |
|
|---|---|---|---|---|---|
|
1Q |
16.8 |
8.7 |
15.6 |
11.3 |
7.3 |
|
2Q |
29.1 |
18.9 |
26.4 |
20.4 |
14.3 |
|
3Q |
42.2 |
28.8 |
38.7 |
18.4 |
-24.8 |
|
Full-year |
43.3 |
38.9 |
46.2 |
7.3 |
-54.8 |
Profit attributable to owners of parent
- Negative figures are not displayed in this graph. For actual figures, please refer to the table below.
(billion yen)
|
FY2019 |
FY2020 |
FY2021 |
FY2022 |
FY2023 |
|
|---|---|---|---|---|---|
|
1Q |
11.8 |
7.4 |
11.5 |
8.3 |
6.7 |
|
2Q |
20.2 |
15.1 |
19.4 |
15.3 |
12.0 |
|
3Q |
29.7 |
22.0 |
28.5 |
15.7 |
-14.7 |
|
Full-year |
28.1 |
28.9 |
35.0 |
8.7 |
-49.9 |
Total assets, loans, deposits
(billion yen)
|
Mar. 2020 |
Mar. 2021 |
Mar. 2022 |
Mar. 2023 |
Mar. 2024 |
|
|---|---|---|---|---|---|
|
Deposits / |
3,396.8 |
4,012.5 |
4,871.5 |
5,497.3 |
5,776.3 |
|
Loans and bills discounted |
2,954.1 |
2,948.8 |
3,317.1 |
3,881.3 |
4,071.2 |
|
Total assets |
5,299.8 |
5,916.8 |
6,728.6 |
7,184.0 |
7,603.0 |
- The point of time (month-year) in the table represents the end of each month.
Capital adequacy ratio*
(billion yen)
|
Mar. 2020 |
Mar. 2021 |
Mar. 2022 |
Mar. 2023 |
Mar. 2024 |
|
|---|---|---|---|---|---|
|
Capital |
10.29% |
11.03% |
10.37% |
9.43% |
9.23% |
|
Regulatory |
473.1 |
481.5 |
500.3 |
490.0 |
429.0 |
- * Basel 3, Domestic standard. Mar. 2024: Preliminary basis
- The point of time (month-year) in the table represents the end of each month.
PL summary
(billion yen)
|
FY2019 |
FY2020 |
FY2021 |
FY2022 |
FY2023 |
||||||
|---|---|---|---|---|---|---|---|---|---|---|
|
1Q |
Interim |
3Q |
Full-year |
|||||||
|
Net revenue |
95.7 |
96.5 |
103.0 |
59.5 |
17.7 |
44.5 |
60.6 |
50.9 |
||
|
Net interest income |
48.7 |
50.0 |
51.6 |
51.0 |
12.0 |
25.1 |
33.9 |
42.0 |
||
|
Non-interest income |
46.9 |
46.4 |
51.3 |
8.4 |
5.7 |
19.4 |
26.6 |
8.8 |
||
|
Net fees and commissions |
12.6 |
12.4 |
14.0 |
13.3 |
4.0 |
10.3 |
14.7 |
20.4 |
||
|
Net trading revenues |
18.0 |
13.4 |
16.6 |
4.1 |
-1.7 |
0.1 |
0.7 |
1.6 |
||
|
Net other ordinary income |
16.1 |
20.5 |
20.7 |
-9.0 |
3.3 |
8.9 |
11.1 |
-13.2 |
||
|
General & administrative expenses |
-53.3 |
-54.9 |
-57.7 |
-59.3 |
-15.0 |
-30.4 |
-45.6 |
-61.8 |
||
|
Gains/losses on equity |
- |
1.1 |
2.6 |
2.3 |
0.5 |
1.4 |
2.2 |
2.3 |
||
|
Business profit |
42.3 |
42.6 |
47.8 |
2.5 |
3.1 |
15.6 |
17.2 |
-8.5 |
||
|
Credit-related expenses |
-11.7 |
-4.3 |
-3.7 |
-1.7 |
-0.9 |
-9.9 |
-42.9 |
-46.9 |
||
|
Gains/losses on stock transactions |
11.6 |
2.3 |
2.0 |
8.4 |
5.7 |
9.4 |
1.5 |
1.6 |
||
|
Ordinary profit |
43.3 |
38.9 |
46.2 |
7.3 |
7.3 |
14.3 |
-24.8 |
-54.8 |
||
|
Taxes |
-17.7 |
-12.2 |
-12.9 |
-0.6 |
-1.1 |
-3.4 |
8.8 |
1.4 |
||
|
Gains/losses attributable to |
2.5 |
2.2 |
1.9 |
2.0 |
0.5 |
1.0 |
1.3 |
1.8 |
||
|
Profit attributable to owners of parent |
28.1 |
28.9 |
35.0 |
8.7 |
6.7 |
12.0 |
-14.7 |
-49.9 |
||
Balance sheet summary
(billion yen)
|
Mar. 2020 |
Mar. 2021 |
Mar. 2022 |
Mar. 2023 |
Mar. 2024 |
||
|---|---|---|---|---|---|---|
|
Loans and bills discounted |
2,954.1 |
2,948.8 |
3,317.1 |
3,881.3 |
4,071.2 |
|
|
Securities |
1,073.6 |
1,393.3 |
1,478.1 |
1,278.7 |
1,186.5 |
|
|
Cash and due from banks |
464.2 |
950.1 |
1,141.9 |
1,275.0 |
1,579.7 |
|
|
Trading assets |
259.3 |
154.6 |
133.0 |
151.2 |
173.7 |
|
|
Other |
548.3 |
469.9 |
658.3 |
597.6 |
591.6 |
|
|
Total assets |
5,299.8 |
5,916.8 |
6,728.6 |
7,184.0 |
7,603.0 |
|
|
Deposits / Negotiable certificates of |
3,396.8 |
4,012.5 |
4,871.5 |
5,497.3 |
5,776.3 |
|
|
Debentures / Bonds |
259.9 |
198.3 |
168.9 |
147.7 |
181.3 |
|
|
Borrowed money |
427.6 |
349.7 |
432.3 |
525.6 |
563.3 |
|
|
Cash collateral received for securities lent |
281.3 |
431.6 |
356.9 |
215.9 |
260.6 |
|
|
Trading liabilities |
211.2 |
140.4 |
129.2 |
121.8 |
165.0 |
|
|
Other |
298.0 |
294.0 |
282.3 |
244.3 |
265.0 |
|
|
Total liabilities |
4,875.0 |
5,426.8 |
6,241.3 |
6,752.9 |
7,211.9 |
|
|
Total net assets |
424.7 |
490.0 |
487.2 |
431.1 |
391.0 |
|
|
Total liabilities and net assets |
5,299.8 |
5,916.8 |
6,728.6 |
7,184.0 |
7,603.0 |
|
- The point of time (month-year) in the table represents the end of each month.
Results by business segment*
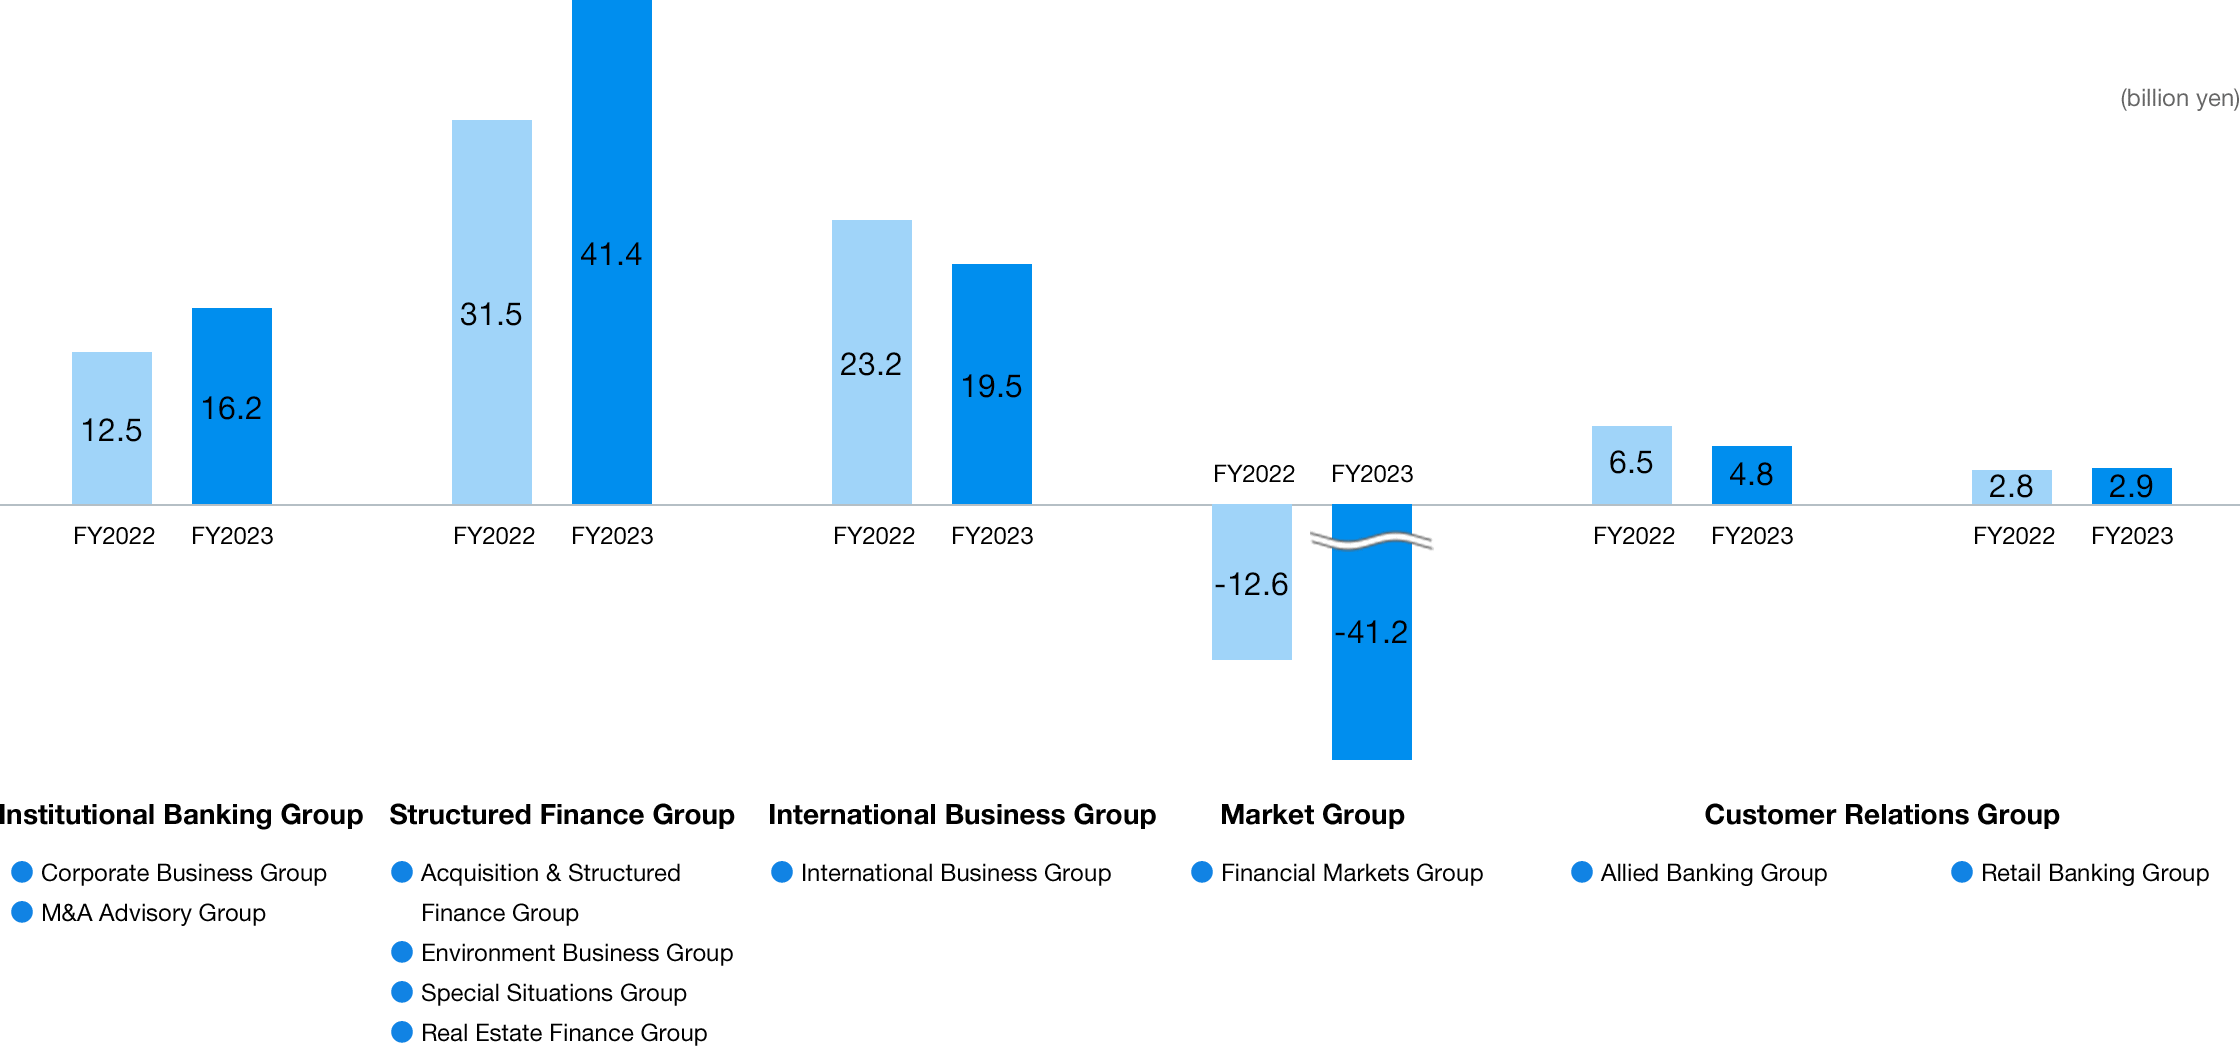
- Business revenue (total of net revenue, gains/losses on equity method investments and stock transactions; management accounting basis)
- Figures for 2Q include all results starting from 1Q up through 2Q, and figures for 3Q include all results starting from 1Q up through 3Q.
- Figures are rounded down to the nearest specified unit and ratios are rounded off to two decimal places.